Dashboard

The dashboard provides a quick overview of a day's activities and goals. It contains several widgets with different data sets. The left and right arrows can be used to switch between days and there's a calendar view for displaying the current month.
Data for the dashboard is aggregated from all paired devices by default, or (if so configured) from selected devices.
To view dashboard, click Dashboard icon from the bottom menu while in home screen.
Widgets
Today

The Today widget shows a chronological overview of the activities of the selected day. Included are sleep (blue), activities detected by Gadgetbridge (green) and exercises detected by the devices (orange).
Two modes are currently available: 24 hour mode and 12 hour mode. This screenshot shows the 12 hour mode. In 24 hour mode, a single circle would be shown.
Data is aggregated from the configured devices, but not everything is displayed. The widget assumes one wearer of multiple devices, so for each timestamp it just displays the data type with the highest priority:
- Device-detected exercise
- Gadgetbridge-detected activity
- Sleep
- Worn / not worn
Goals

The Goals widget provides a single combined goals chart. Each of the separate gauges outlined below are also represented in the combined Goals widget.
It can be configured to be displayed smaller or without legend.
Gauges

Several simple gauges are available to display the current day's goal status. These can be enabled or disabled separately in the settings, but do not have further configuration.
- Steps
- Distance
- Active time
- Sleep time
- Sleep score
- Body energy
- Heart Rate Variability (HRV)
- PAI
- Stress
- VO₂ Max
Note that this screenshot also shows some settings in action: no frames (cards) around widgets, and the smaller sizes of the Today and Goals widgets.
Calendar

The calendar view can be opened by tapping on the calendar icon in the top right of the dashboard.
The currently shown day on the dashboard determines on which month the calendar will open. In this screenshot, a past month was opened, showing a colored indicator for the percentage of the steps goal reached on each day.
To the bottom of the calendar, an indicator is shown that visually represents the amount of days the step goal was reached, or which percentage of the steps goal.
All these colors make it easy to determine whether a month was an active one, or to give an incentive to do better.
Settings
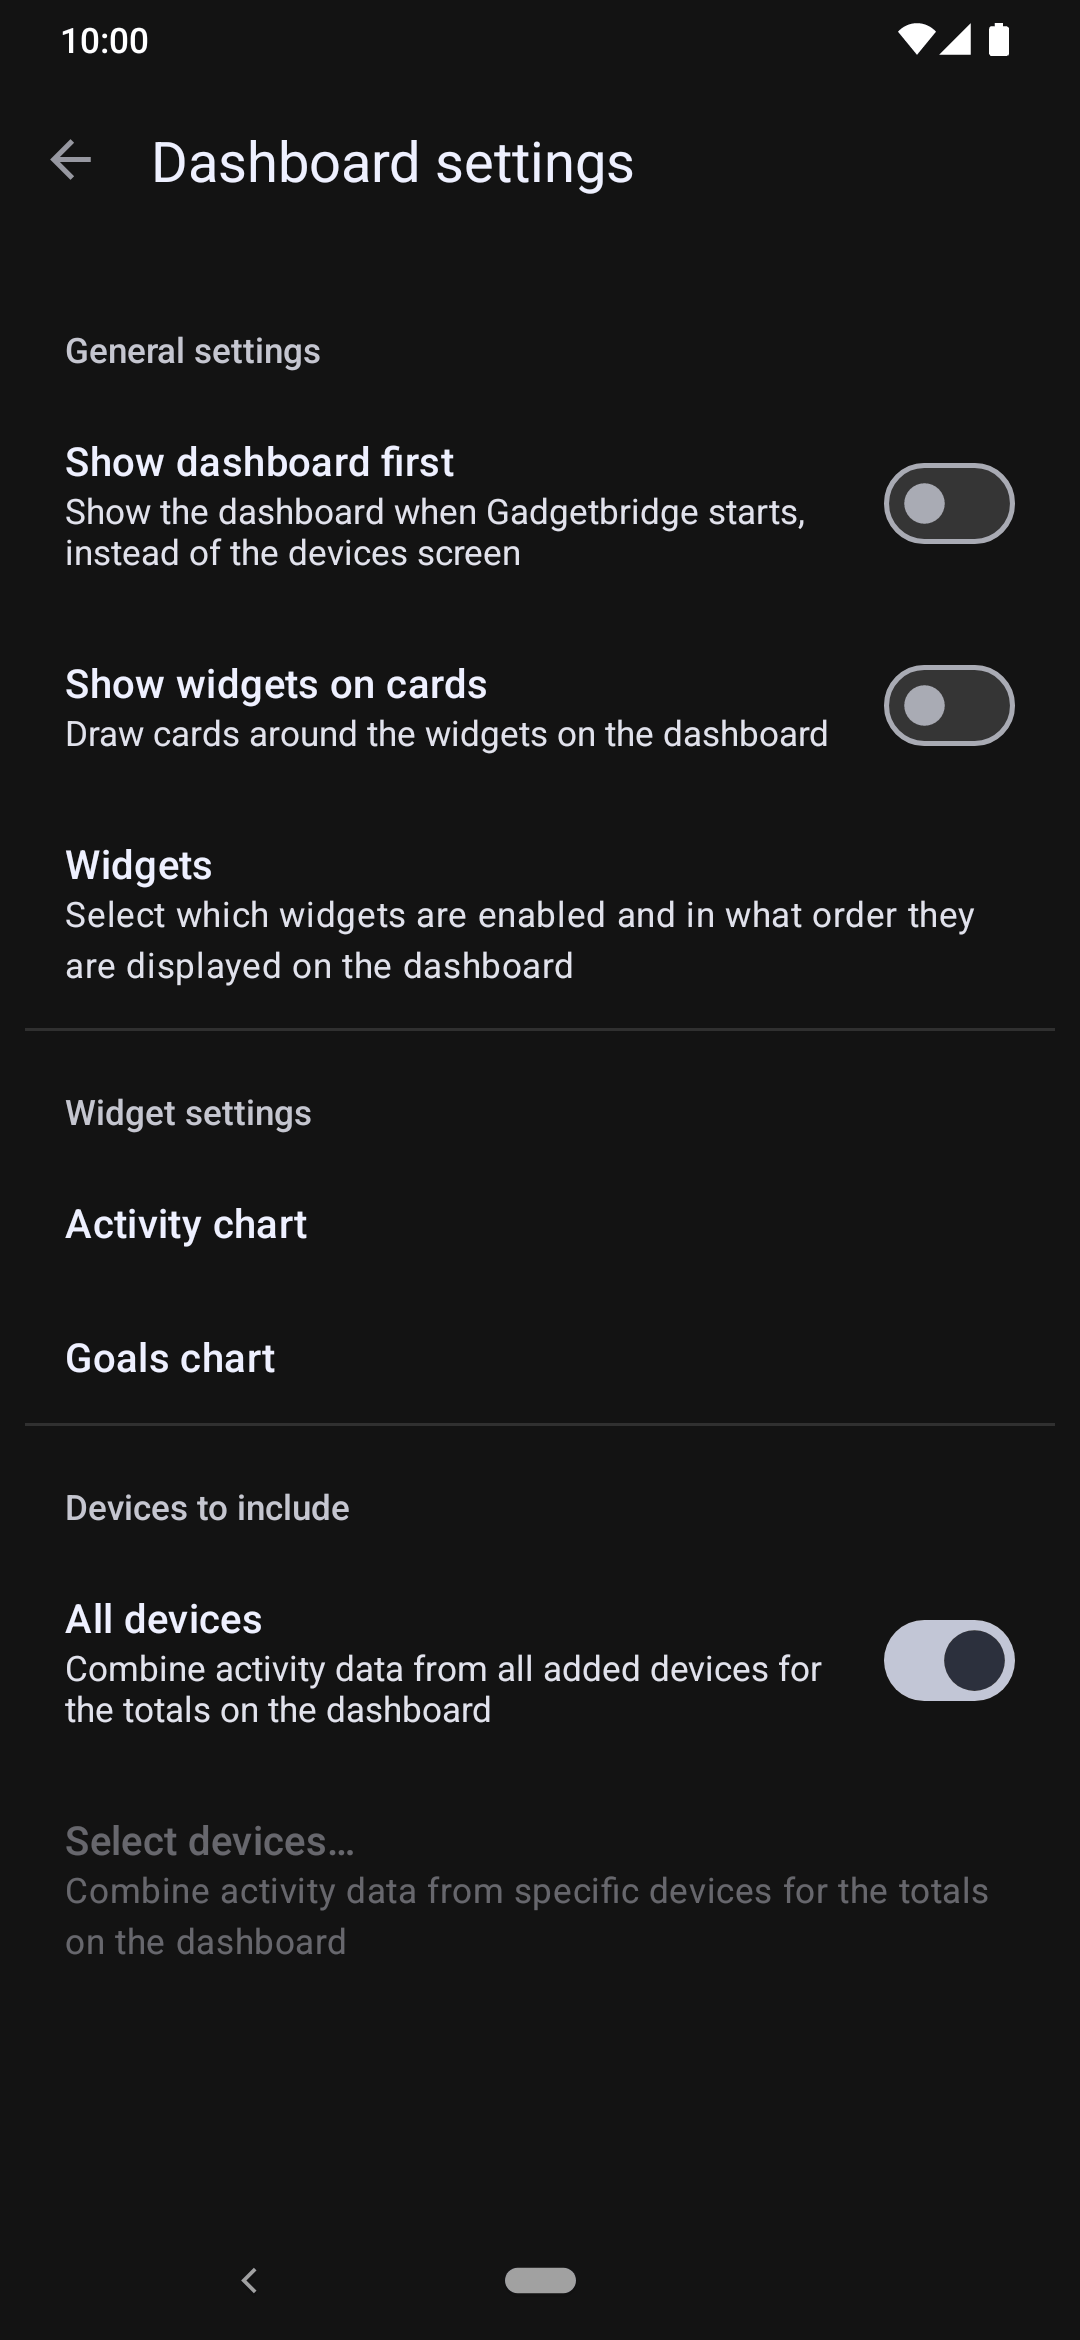
The settings screen can be found in the main Gadgetbridge settings under "Dashboard".
Many aspects of the dashboard can be configured, like which widgets are shown, in what order, their size and style.
It's also possible to select certain devices from which to include data on the dashboard, rather than using data from all paired devices.